

Capstone believes the EU’s proposal to ease car and van emissions standards will reduce electric vehicle (EV) sales, pushing public fast-charging utilisation further below profitable levels. Member States will likely implement subsidy schemes for public charging operators. Fleet charging (guaranteed demand) and integrated fuel retailers (diversified revenue) offer better risk-adjusted returns.
- The European Commission’s December 2025 Automotive Package proposes easing emissions standards, lowering the 2035 reduction target from 100% to 90%. This is expected to reduce battery electric vehicle (BEV) market share in 2030 from 61% to 44%. Meanwhile, the Alternative Fuels Infrastructure Regulation (AFIR) continues to mandate fast chargers every 60 km along the Trans-European Transport Network (TEN-T).
- Our estimates suggest this supply-demand mismatch will push public fast-charging utilisation down to 11% by 2030 (from the current 14%), creating a widening gap against the estimated viability threshold of 15%–20%. This will reduce annual operator returns to ~6% (vs. ~13% currently), driving an estimated €3.4 billion annual revenue shortfall across the sector. Member States will likely subsidise operators to meet AFIR compliance, shifting the market toward subsidy dependence.
- Pure-play public charging operators face significant downside risk, while depot/fleet charging and diversified fuel retailers offer better risk-adjusted opportunities.
A Regulatory Mismatch Poses Risks for Public EV Charging Operators
Regulation (EU) 2023/1804, or the Alternative Fuels Infrastructure Regulation (AFIR), mandates aggressive EV charging infrastructure deployment regardless of market demand dynamics:
- Light-duty vehicles (LDV): The regulation requires direct current (DC) fast charging stations (≥150 kilowatts (kW)) every 60 kilometres (km) along the core Trans-European Transport Network (TEN-T). Western European markets (Germany, France, the Netherlands, and Belgium) have largely met these distance-based coverage targets, although power output upgrades remain necessary to meet 2026 pool capacity requirements.
- Heavy-duty vehicles (HDV): AFIR requires charging hubs with a total pooled power of 1.4 MW (and at least one ≥350 kW charger) every 60 km along the 29,000 km core network. Only 313 HDV charging locations in the EU currently offer AFIR-compliant facilities.
Exhibit 1: Distribution of EV Recharging Points in the EU27
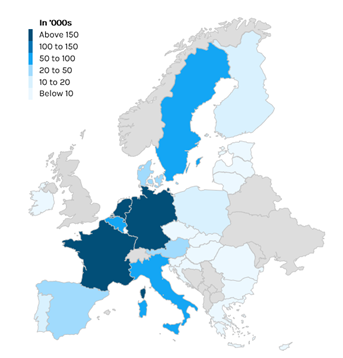
Source: European Alternative Fuels Observatory (EAFO)
The EU’s 16 December 2025 Automotive Package proposal would create a supply-demand mismatch by weakening the incentive for battery EV adoption. By expanding compliance pathways to include plug-in hybrid electric vehicles (PHEVs) and low-carbon fuels (including e-fuels), rather than requiring full battery electrification, the Commission would be reintroducing technology optionality. The shift from a de facto 100% zero emission trajectory to a 90% tailpipe reduction target reinforces this flexibility, allowing combustion engine platforms to remain viable beyond 2035 under certain compliance pathways.
Proposal Poses a Threat to BEV Sales
Modelling by the International Council on Clean Transportation (ICCT) indicates BEV market share of new sales in 2030 will reach only 44% under the revised standards—17 percentage points below the 61% projected under current regulations. This translates to 5 million fewer BEVs sold between 2026 and 2030 compared to current standards.
Investment Implications
Charging infrastructure business models rely on high operating leverage; fixed costs are significant, meaning profitability is highly sensitive to utilisation (sessions per day). Current operators invested heavily based on projections that accelerating BEV penetration would push session volumes toward commercial viability (typically at least 15%–20% utilisation).
The December 2025 proposal undermines these projections. With the 2030 EU BEV fleet likely reaching only 34 million vehicles (vs. 39 million expected), demand will likely be insufficient to achieve profitable utilization levels, potentially rendering specific greenfield investments uneconomic.
With the BEV new sales share expected to drop by ~28%, the total 2030 BEV fleet will be ~13% lower, reflecting the existing stock. However, because infrastructure deployment is mandated by AFIR (rigid supply) rather than demand-led, this 13% volume gap translates directly into a utilisation drop.
In effect, rigid supply growth combined with structurally weaker demand mechanically locks utilisation below commercial thresholds.
Quantifying the revenue and return shortfall
With infrastructure deployment outpacing demand growth, we project station-level utilisation will deteriorate from the current ~14.4% to 11.2% by 2030. At this level, station return on invested capital (ROIC) falls to 6.4%, well below the cost of capital typically required for merchant infrastructure assets.
While ROIC falling below the cost of capital would typically halt private deployment, AFIR mandates suggest that Member States will prioritise compliance and rollout continuity, increasing the probability of public support mechanisms (e.g., capex grants, operating support, and/or revenue guarantees). This introduces non-competitive, policy-backed supply that sustains structural overcapacity, preventing the natural supply side correction (and utilisation recovery) on which private capital typically relies.
The 13% demand contraction, in conjunction with continued mandated rollout, creates a “scissor” dynamic in which weaker demand is spread across a larger installed base, pushing utilisation from 14.4% to 11.2%.
Exhibit 2: Average Charging Station-level ROIC at Different Utilisation Levels
| Utilisation Level | 20% | 14.4% | 12.8% | 11.2% |
| Annual units delivered (MWh) | 677.8 | 488.0 | 434.6 | 378.8 |
| Annual revenue (@ €0.67/kWh) | €454.1K | €327.0K | €291.2K | €253.8K |
| Annual gross profit (@ €0.47/kWh) | €318.6K | €229.4K | €204.3K | €178.0K |
| Operating cost | €128.0K | €128.0K | €128.0K | €128.0K |
| Operating profit | €190.6K | €101.4K | €76.3K | €50.0K |
| ROIC | 24.4% | 13.0% | 9.8% | 6.4% |
Source: ICCT; Fastned; Capstone analysis
Note: Current utilisation (14.4%) based on Fastned’s 2025 data. ROIC figures represent merchant returns absent public support.ROIC calculation assumes average capital investment of €781,000 per station.
The need for public support in the short term
AFIR compliance requirements increase the likelihood that Member States will subsidise rollout to maintain network continuity and avoid infringement risk.
Public support mechanisms, such as capital grants covering 30%-50% of capex, operational support to reduce effective opex, and revenue guarantee schemes, could restore target returns to 12%-15%.
However, this fundamentally transforms the investment case: public charging shifts from a pure market play into a policy-dependent bet. Investors would have to assess subsidy design (eligibility, coverage levels, clawback provisions), political durability (budget sustainability over a 5-10-year horizon), counterparty risk (Member State fiscal capacity), and regulatory stability (potential AFIR or CO2 standard revisions), alongside demand fundamentals.
The market effectively becomes a quasi-utility sector where success depends on navigating Member State support frameworks rather than purely commercial economics.
Assumptions and calculations
Our baseline model relies on the following unit economics and market assumptions, based on the Fastned BV (FAST on the Amsterdam exchange) June 2025 Investor Presentation:
- Charging station economics
- Annual charging demand: 488 MWh (at effective rating of 387 kW at 80% efficiency)
- Current utilisation: 14.4% (implies 51 charging sessions per station per day)
- Average session size: 26.22 kWh
- Average investment (capex): €781,000 per station
- Operating costs per station (opex): €128,000 annually
- Revenue per kWh: €0.67
- Cost of goods sold (electricity + fees): €0.20 per kWh
- Infrastructure and energy demand (2030 projections)
- Infrastructure: 545,000 DC fast charging points across ~90,834 stationsPublic Share: Public fast-charging accounts for 34.9% of total demandPer-BEV Demand: Annual public fast-charging electricity demand per BEV is 1.012 MWh (calibrated at 39 million BEVs). This represents public fast charging demand only, which accounts for 34.9% of total BEV recharging demand.
- Derivation of 11.2% utilisation: We calculated the revised annual energy demand (34 million BEVs × 1.012 MWh public demand) and divided it by the total theoretical capacity of the 545,000 projected charging points
- Formulae used
- Utilisation level = Total annual energy delivered ÷ (90,834 stations x 387 kW effective rating × 24 × 365)
- ROIC = ((Gross profit – Operating costs) ÷ Average investment) × 100
- Revenue gap calculation
- The estimated gap in the 2030 BEV fleet is 5 million vehicles
- Pre-revision revenue: 39 million BEVs × 1.012 MWh/year × €0.67 = €26.44 billion.
- Revised revenue: 34 million BEVs × 1.012 MWh/year × €0.67 = €23.05 billion.
- Result: we estimate an annual revenue reduction of €3.4 billion (13%) for the overall EU charging infrastructure market compared to the pre-revision baseline.
Winners and Losers
High risk exposure: merchant models
- Pure-play LDV charge point operators (CPOs): Companies acquired during 2021–2023 peak valuations face valuation pressure, with some already experiencing stress.
- Greenfield HDV charging developments: Each AFIR-compliant charging hub requires ~€3 million in investment (factoring in grid connection and civil works). However, flexibility mechanisms in the HDV mandate (allowing credits and biofuels) create a substitution risk: hauliers may opt for compliance-friendly internal combustion engine (ICE) trucks rather than BEVs, leaving high-capex assets underutilised. While our utilisation and ROIC modelling is calibrated on LDV public fast-charging economics, the same demand-timing mismatch applies directionally to greenfield HDV hubs, where higher capex magnifies downside risk.
Lower risk exposure: contracted and diversified models
- Depot/private fleet charging: BEVs (and PHEVs) charge at the depot, insulated from public utilisation risk. Long-term contracts (5–10 years) provide revenue visibility. This segment requires lower capex (~€1 million per site) and benefits from 80%–90% fleet utilisation.
- Integrated energy majors and fuel retailers, e.g., Shell PLC (SHEL on the London exchange), TotalEnergies SE (TTE on the London exchange), and Circle K—a subsidiary of Alimentation Couche-Tard Inc. (ATD on the Toronto exchange): These players benefit from a natural hedge: PHEV/ICE fuel consumption generates revenue at the pump, offsetting charging underperformance. Co-location with existing service stations reduces effective capital intensity.
Conclusion
The EU’s automotive package proposal decouples AFIR’s supply mandate from market demand, suppressing utilisation to 11.2% and unsubsidised ROIC to 6.4%. We believe this will compel Member States to implement subsidy schemes to restore viable returns (12%-15%), transforming public charging from a merchant to a subsidy-dependent market.
Investment positioning should thus pivot from merchant exposure to contracted and policy-insulated models. Depot/fleet charging backed by long term contracts (5-10 years) and integrated energy majors with PHEV/ICE hedges offer superior risk-adjusted returns.
Investment in public charging requires strict capital discipline. We recommend limiting greenfield deployment to high-traffic TEN-T corridors (>18% utilisation) and/or markets with legislated subsidy frameworks, while allocating 12-24 months to build subsidy intelligence and develop Member State relationships.
We also recommend that due diligence teams immediately reconcile their forecasts using post-December 2025 ICCT projections (44% market share, 34 million BEVs, 11.2% utilisation) and stress test debt covenants against 6.4% merchant ROIC scenarios. Separately, we recommend modelling subsidy-adjusted returns (12%-15% ROIC) to establish valuation ranges and monitoring Member State subsidy design (Germany, France, and the Netherlands as first movers), Regulation on Clean Corporate Vehicles proposal emissions thresholds, and AFIR implementation flexibility.
What’s Next
- Legislative path: The Commission’s proposal will now move into Council and European Parliament negotiations under the ordinary legislative procedure; amendments on PHEVs, e-fuels, and crediting will be key in determining the 2030 BEV trajectory.
- Timing: We expect policy uncertainty to persist through 2026, limiting visibility for 2026–2030 deployment and financing assumptions until Parliament/Council positions converge.
- AFIR is binding: rollout obligations will continue even if demand weakens, increasing pressure on Member States to implement subsidies to bridge merchant returns.
- Key variable to monitor (next 12–24 months): subsidy scheme design (grant intensity, revenue guarantees, tender structure, clawbacks) will be crucial to monitor as Member States translate compliance into funding frameworks.
Read more from Capstone’s energy team:
EU to Tighten Biosolutions Rules: Projected Risks and Opportunities
Europe’s Hard Choice: The Continent’s Climate and Competitiveness Dilemma
The EU Moves Toward A Russian Gas Ban